We now offer a range of solutions to allow logging and visualisation of data produced by various connected devices. Examples of data are:
- Temperature
- Wind
- Blood pressure
- Tidal gauge
- Internal combustion engine monitoring
- Surveys and quizzes
Logging is to a full relational database supporting complex queries and export.
These devices can be connected via GPRS, WiFi, Bluetooth, Zigbee or even sat modem. Our system will automatically choose an optimal algorithm to tailor the payload size and latency to the available channels. The sensors range from embedded processors through to PCs and smartphones.
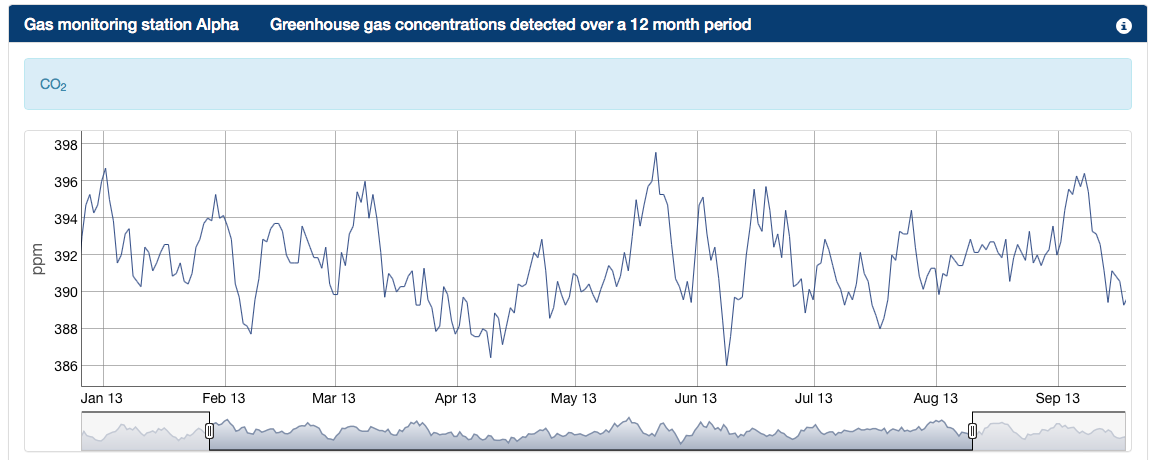
Data is visualised in a web browser. So can be viewed using a tablet, PC or smartphone. We support various bespoke alarms with an array of triggers and notification options.
See a fully interactive demonstration of environmental monitoring here. Or the screenshot below.
 Contact info@winchesterinnovation.co.uk for more information, or use the Contact Us form.
Recent Comments